What better way to pass a Sunday afternoon than to look at Statistics. Landmark 2019 is well and truly behind us, but it’s legacy will have an impact on all participants be they vendor or purchaser. Like any sale there would be disappointed vendors, balanced by jubilant purchasers and vice versa.
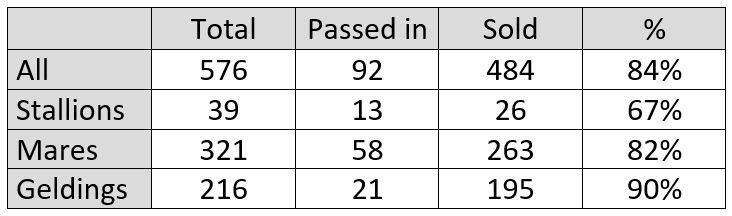
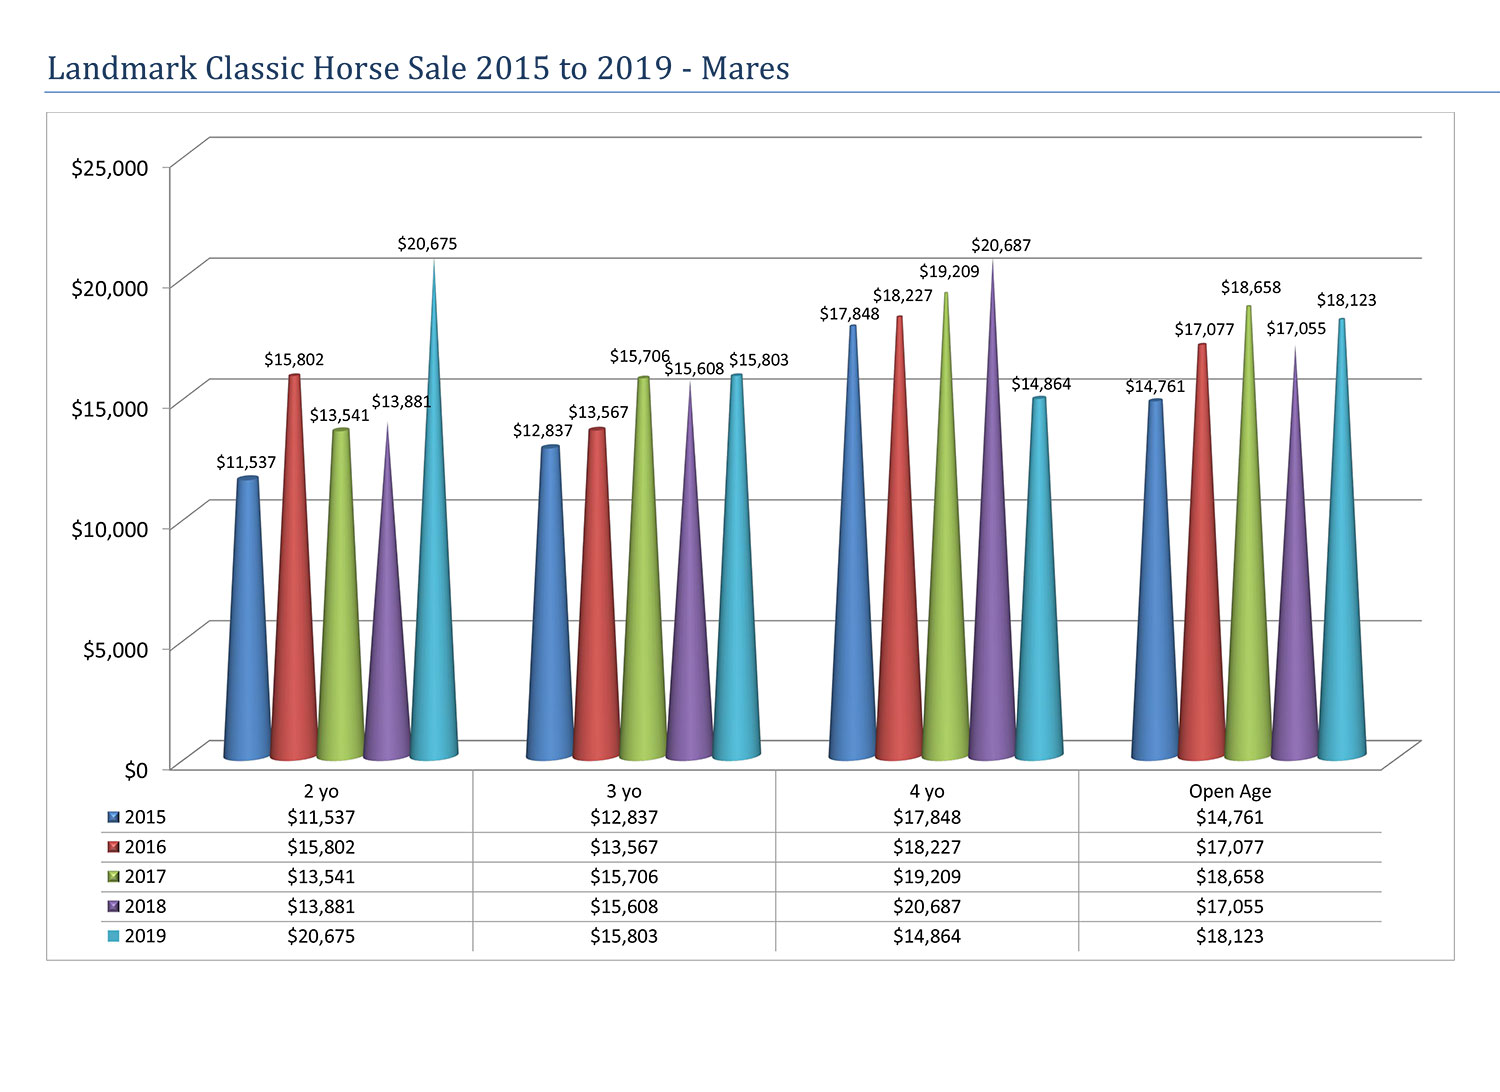
So exactly how did the sale go? The figures drawn from Landmark Live provide a brilliant insight in to the sale. Read into them what you will.